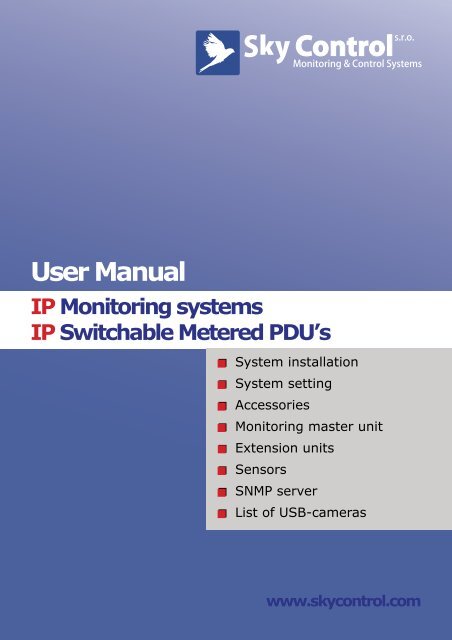
User Manual
User Manual
User Manual

You also want an ePaper? Increase the reach of your titles
YUMPU automatically turns print PDFs into web optimized ePapers that Google loves.
<strong>User</strong> <strong>Manual</strong><br />
IP Monitoring systems<br />
IP Switchable Metered PDU’s<br />
■■<br />
■■<br />
■■<br />
■■<br />
■■<br />
■■<br />
■■<br />
■■<br />
System installation<br />
System setting<br />
Accessories<br />
Monitoring master unit<br />
Extension units<br />
Sensors<br />
SNMP server<br />
List of USB-cameras<br />
www.skycontrol.com
- 02 -<br />
Contents<br />
1. System installation.............................................................................................<br />
1.1 Turning on the Monitoring System.............................................................. 6<br />
1.2 Configuration of system network parameters............................................ 6<br />
Use of factory-specific settings...................................................................... 6<br />
Backup and restore system settings................................................................ 8<br />
Updating monitoring system software using USB memory sick................... 8<br />
Updating monitoring system software through FTP...................................... 9<br />
Recovering lost IP-address of master unit..................................................... 10<br />
1.3 System time synchronization........................................................................ 10<br />
1.4 Connection and removal of extension units and sensors........................... 11<br />
Connection and removal of the extension units............................................. 11<br />
Connection of analog sensor........................................................................... 11<br />
Connection of digital sensor........................................................................... 12<br />
Removal of analog and digital sensors........................................................... 12<br />
1.5 Connection of devices to relay outputs........................................................ 12<br />
1. 6 Connection of reader ................................................................................... 13<br />
Connection of I-Touch Button reader............................................................. 13<br />
Connection of Proximity reader..................................................................... 13<br />
Adding key to user database........................................................................... 14<br />
1.7 Saving system configuration settings........................................................... 15<br />
2. System setting.......................................................................................................<br />
2.1 Setting system log.......................................................................................... 17<br />
Viewing system log........................................................................................ 17<br />
Storing log messages of FTP server/Syslog server........................................ 17<br />
2.3 Setting parameters of sensors, sensor threshold levels .............................. 19<br />
Setting temperature, humidity, voltage sensors.............................................. 19<br />
Setting other sensors....................................................................................... 23<br />
Setting relay.................................................................................................... 24<br />
2.4 Setting notifications....................................................................................... 25<br />
Notification via e-mail (E-mail alerts)........................................................... 25<br />
Notification via SMS - installation and configuration of<br />
GSM-modem.................................................................................................. 26<br />
Remote control of monitoring system using SMS-commands............................. 28<br />
<strong>User</strong> <strong>Manual</strong><br />
6<br />
17
<strong>User</strong> <strong>Manual</strong><br />
- 03 -<br />
Contents<br />
Command: reading sensor parameters............................................................ 28<br />
Command: setting state of relay/outlet........................................................... 28<br />
Notification via SMS...................................................................................... 29<br />
Notification through UDP (SNMP Trap)....................................................... 29<br />
Notification via ICQ or AIM.......................................................................... 30<br />
Removal of notifications................................................................................. 31<br />
Сontrol of monitoring system using ICQ....................................................... 31<br />
2.5 Setting timers................................................................................................. 33<br />
Adding timer.................................................................................................... 33<br />
Removal of Timer........................................................................................... 34<br />
2.6 Ping service..................................................................................................... 34<br />
Adding server to ping..................................................................................... 34<br />
Removal of ping request................................................................................. 35<br />
2.7 Application of maps and plans of object...................................................... 35<br />
Creating or changing object map................................................................... 35<br />
Assigning sensors to location on map............................................................ 35<br />
Removal of maps........................................................................................... 36<br />
2.8 Adding logic circuit....................................................................................... 36<br />
Creation of logic circuit.................................................................................. 37<br />
Removal of logic circuit................................................................................. 38<br />
2.9 Adding logic groups....................................................................................... 38<br />
2.10. COM-port remote control.......................................................................... 39<br />
2.11. Connection of USB camera........................................................................ 41<br />
2.12 IP Web-cameras........................................................................................... 42<br />
Adding IP-camera........................................................................................... 42<br />
Removal of IP-camera.................................................................................... 43<br />
2.13 Application of dynamic DNS Update......................................................... 43<br />
Updating dynamic IP address on dynamic DNS services.............................. 43<br />
Setting up router............................................................................................. 43<br />
Application of dynamic DNS......................................................................... 44<br />
3. Accessories.............................................................................................................. 45<br />
4. Monitroring master unit..................................................................................<br />
4.1 IP monitoring units – 5500.824, 5510.824.................................................. 46<br />
46
- 04 -<br />
Contents<br />
Description of I/O on the front panel of 5500.824/ 5510.824....................... 46<br />
LEDs on the front panel of 5500.824/ 5510.824.......................................... 46<br />
Description of I/O on the back panel of 5500.824......................................... 47<br />
Description of I/O on the back panel of 5510.824......................................... 48<br />
4.2 IP Switchable Metered PDUs – 5510.108, 5510.008................................... 49<br />
Description of outlets on the front panel of 5510.008/ 5510.108................. 49<br />
LEDs on the front panel of 5510.008/ 5510.108.......................................... 49<br />
Description of I/O on the IP PDU back panel of<br />
5510.008/ 5510.108....................................................................................... 50<br />
5. Extension units.....................................................................................................<br />
5.1 Relay-sensor units – 5505.814, 5505.816..................................................... 51<br />
Description of I/O on the front panel of 5505.814, 5505.816....................... 51<br />
LEDs on the front panel of 5505.814, 5505.816........................................... 52<br />
Description of I/O on the back panel of 5505.814......................................... 52<br />
Description of I/O on the back panel of 5505.816......................................... 53<br />
5.2 Dry contacts unit (BU) – 5505.016............................................................... 54<br />
Description of I/O on the front panel of 5505.016....................................... 54<br />
Description of I/O on the back panel of 5505.016........................................ 55<br />
LEDs of 5505.016......................................................................................... 55<br />
5.3 GSM modem 5500.900.................................................................................. 56<br />
6. Sensors...................................................................................................................... 57<br />
6.1 Analog Sensors............................................................................................... 57<br />
Indoor temperature sensor – 5500.500.......................................................... 57<br />
Outdoor temperature sensor – 5500.501........................................................ 57<br />
Humidity sensor – 5500.511.......................................................................... 58<br />
AC voltage monitor – 5500.520..................................................................... 58<br />
Installation of AC voltage monitor................................................................. 59<br />
DC voltage monitor – 5500.525.................................................................... 59<br />
Access sensor – 5500.530.............................................................................. 60<br />
Installation of contact sensor.......................................................................... 60<br />
Vibration sensor – 5500.540.......................................................................... 60<br />
Airflow sensors – 5500.550........................................................................... 61<br />
Smoke sensor – 5500.560.............................................................................. 61<br />
<strong>User</strong> <strong>Manual</strong><br />
51
- 05 -<br />
Contents<br />
Installation of smoke sensor........................................................................... 62<br />
Motion sensor – 5500.570............................................................................. 62<br />
Leakage sensor – 5500.590............................................................................ 63<br />
Water cable detector – 5500.591.................................................................... 63<br />
6.2 Digital sensors................................................................................................ 64<br />
Humidity and temperature sensor – 5500.731............................................... 64<br />
Smoke and temperature sensor – 5500.760................................................... 65<br />
Installation of smoke sensor........................................................................... 65<br />
Motion and temperature sensor – 5500.770.................................................. 65<br />
6.3 Readers........................................................................................................... 66<br />
7. SNMP Server.........................................................................................................<br />
8. List of USB-cameras supported by the system of<br />
monitoring Sky Control........................................................................................<br />
67<br />
67<br />
<strong>User</strong> <strong>Manual</strong>
System installation<br />
- 06 -<br />
Attention! Only the person with high-level technical skills should install and setup the<br />
monitoring system.<br />
1.1 Turning on the Monitoring System<br />
Connection of master unit is made in the following order:<br />
1. Install any master unit.<br />
2. Connect the power supply to a power source. For this purpose it is necessary<br />
(in 5500.824 unit) to plug the power cord into the outlet 230V, and to connect<br />
the other end of 12V pin to the connector on the back panel of unit. For the units<br />
5510.xxx you need to connect the power cord to the module and outlet 230V.<br />
3. Connect master unit to local network by means of UTP or FTP cable. One<br />
end of cable is connected to connector 100 Mbit on the front panel of the master<br />
unit, the other end to port of the network switch.<br />
4. Wait until the indicator ‘PWR’ lights up on the front panel of the unit, and<br />
indicator ‘ACT’ starts to blink (approximately in 30 seconds after submission of<br />
power).<br />
If indicator PWR on the front panel of master unit is on, and indicator ACT blinks with<br />
frequency of 1 time per second, unit is connected correctly.<br />
1.2 Configuration of system network parameters<br />
Network parameters of monitoring system have to be configured to have an opportunity of<br />
a further system configuration, for adjustment of system logic. Configuration of network<br />
parameters of system can be made in three ways.<br />
Use of factory-specific settings<br />
To establish network parameters of monitoring system, it is possible to use the system’s<br />
web-interface, by opening it and using initial factory settings.<br />
Factory network settings of monitoring system:<br />
1. IP-address: 192.168.0.193;<br />
2. Netmask: 255.255.255.0;<br />
3. Other parameters not set.<br />
To get access to web-interface of monitoring system, using factory-specific network settings,<br />
is possible if previous network parameters of the master unit have not been altered.<br />
Follow:<br />
1. Make sure the master unit is connected to a power source and operates (indicator<br />
PWR on the front panel lights up).<br />
Attention! If you don’t have Adobe flash player installed on your computer, web interface of<br />
monitoring system will prompt you to install one. Follow the link ((http://www.adobe.com/go/<br />
getflash/, Internet connection is required). On the requested page press the button “Install now” and<br />
follow further instructions.<br />
<strong>User</strong> <strong>Manual</strong>
- 07 -<br />
2. Make sure that master unit is connected to a local network by means of UTP<br />
or FTP cable. Ensure that your PC is in 192.168.0.* subnet.<br />
3. Open Internet-browser on administrator’s PC (Firefox or any other<br />
that supports Adobe Flash 8), type in the address bar the IP-address<br />
“http://192.168.0.193”. The web-Interface of monitoring system will open. If<br />
the web interface does not open, check that your test computer is in the subnet<br />
192.168.0 .*. Make sure you did not connect the network cable to the RS-485<br />
port. If the problem persists, open interface over an encrypted protocol using IPaddress<br />
“https://192.168.0.193”. Ignore the warning!<br />
4. Answer on the question: Synchronize system time with computers time<br />
now ..OK<br />
Pic. 1.1: Time synchronization from the web-interface<br />
5. In the opened interface select tab “Settings”. If required, change the interface<br />
language in the field “Language». Refresh your browser. Attention! Interface<br />
language changes only after you refresh the browser.<br />
6. In the opened interface select tab «Network»<br />
7. In the fields “IP address” and “Netmask” enter required values (Pic. 1.2),<br />
press the button “Save and close”. Configuration of network parameters of the<br />
master unit is finished.<br />
<strong>User</strong> <strong>Manual</strong><br />
Pic. 1.2: Tab “Network” is opened in system interface
- 08 -<br />
To make sure, that network parameters of the system unit are configured, open the webinterface<br />
of the system.<br />
After successful configuration of network parameters of the master unit, it is possible to<br />
proceed to configuration of other parameters of system, connection of extension units,<br />
running the system. All other system settings are carried out through web-interface of the<br />
master unit.<br />
Backup and restore system settings<br />
The monitoring system has the ability to save the settings in the backup file and later<br />
restore them. To save file with the system settings, follow these steps:<br />
1. Open tab “Modules” in the system interface. Go to “System Menu”.<br />
2. Select menu item “Download backup file with settings”. A warning will<br />
appear with the description of backup file and you will be asked to save it. (See<br />
Pic. 1.3)<br />
<strong>User</strong> <strong>Manual</strong><br />
Pic. 1.3: Saving backup file with system settings<br />
3. Save the file to Flash and do not change the file name.<br />
To restore system settings the following steps are required:<br />
1. Copy the saved file to the USB memory stick. Do not change file name.<br />
2. Plug the USB memory stick into the USB slot of the monitoring system.<br />
3. Wait until system’s PRG led lights up and then goes out.<br />
4. Remove your USB memory stick from the monitoring system.<br />
5. Reboot the monitoring system: disconnect power cable and connect it again.<br />
System settings will be changed after the system is booted.<br />
Updating monitoring system software using USB memory sick<br />
Attention! When your monitoring system is updated using USB memory stick, all your settings<br />
are restored to default. All your internal settings, setup logs, passwords, names are lost! All network<br />
settings are restored to default. Default settings are as follows: IP address 192.168.0.193, netmask<br />
225.225.225.0. If you want to update the driver and keep the settings, update your system only<br />
through FTP!<br />
To set the network settings for the master unit using this method you will need a USB<br />
flash drive. Perform the following steps.
- 09 -<br />
1. Copy the file “sky-control-firmware.sky” to the root file system of USB<br />
memory stick. Do not change file name. Do not copy more than one file with<br />
extension *.sky to the USB stick. Otherwise firmware update might not be done<br />
correctly.<br />
Attention! Do not change the file name.<br />
2. Make sure that master unit which you are setting up, is connected to a power<br />
source, ( indicator PWR is on).<br />
3. Unplug Ethernet cable.<br />
4. Plug the USB memory stick into the USB slot of the monitoring system.<br />
5. Wait until upgrade process is done. This process usually lasts for 2 minutes.<br />
Please do not unplug the memory stick while upgrade is in process. The Prg<br />
LED on the front panel of the master unit will light up and then go out.<br />
6. Wait until all of the LEDs: Pwr, Alrm, Prg, Act will go out.<br />
7. Remove your USB memory stick from the monitoring system.<br />
Attention! Do not turn off power until all LEDs are off!<br />
8. Reboot the monitoring system: disconnect power cable and connect it again.<br />
9. Wait until the monitoring system is booted. PWR led should be on, ACT led<br />
should be flashing.<br />
10. Check that your system works correctly. Before opening web-interface,<br />
clear web browser’s cache. IP-address of the master unit has been changed to the<br />
default IP-address 192.168.0.193.<br />
If any problem has occurred after upgrading or upgrade has not been done properly, repeat<br />
steps 2 - 8.<br />
Updating monitoring system software through FTP<br />
The monitoring system has the ability to update the software remotely using FTP server.<br />
To update your system with FTP, you need to know FTP server address that hosts the software<br />
file. If you are not using another FTP server, use FTP server, ftp://ftp.unilan.ru. To<br />
update new software versions through FTP perform the following steps.<br />
1. Make sure that master unit which you are setting up, is connected to a power<br />
source, ( indicator PWR is on).<br />
2. Open monitoring system interface in your browser.<br />
3. Open tab “Network”. In the field “FTP server to upgrade firmware<br />
from”, enter the address of update file like: ftp://skycontrol.com/pub/fw-.....sky.<br />
4. Click the link “Update”.<br />
<strong>User</strong> <strong>Manual</strong>
- 10 -<br />
5. Over the next few minutes, monitoring system will automatically download<br />
the download the software file, unzip it and apply the update.<br />
After successful software update the monitoring system must be restarted. This can be<br />
done manually by disconnecting power supply, or remotely by selecting “Reboot system”<br />
in “System menu” of the interface. All the system settings, including IP-address will<br />
remain the same.<br />
Recovering lost IP-address of master unit<br />
Sometimes, as a result of forgetfulness or with a change in administrator, the current value<br />
of IP is lost. If you need to find out the IP-address, connect the USB-drive to a master<br />
unit, the system will automatically copy file “dump log” to the USB flash drive, as well as<br />
all accumulated data from connected sensors and other settings (IP-address). Wait for the<br />
indicator PRG on the front panel to light up and then go out, remove the flash drive, connect<br />
it to your computer and open the newly created file in Notepad or any other text editor.<br />
The file should be named «dumplog-.txt». Monitoring system saves<br />
current IP-address in the first lines of this file. Knowing it you can now install required<br />
network settings.<br />
1.3 System time synchronization<br />
Sky Control monitoring system a has built-in opportunity of time synchronization through<br />
Internet or a local network. When master unit is switched on, time is synchronized with<br />
the remote HTTP-server, however, this is only possible when master unit has Internet access.<br />
Correctly adjust network settings (see above System installation) and Time zone (<br />
see below Network)..<br />
In order to adjust synchronization server, the following actions are required:<br />
1. Open web-interface of system in the Internet browser<br />
2. Go to tab “Network” in the web-interface.<br />
3. In the field “HTTP-server for automatic time synchronization” the factory<br />
address of synchronization HTTP-server is www.google.com. The server can be<br />
changed to any other that is required. Set up system time zone. To do this, select<br />
your current time zone (e.g., UTC +5, Karachi)<br />
<strong>User</strong> <strong>Manual</strong><br />
Pic. 1.4: Time zone<br />
4. Press the button «Save and close».<br />
In addition, the administrator has an opportunity to synchronize time of the master unit<br />
with administrator’s computer time. If time of the computer and time of the master unit<br />
are not the same, at opening system’s web-interface notification will appear, which will<br />
ask you to synchronize time ( See pic. 1.1). Press “ОК” to synchronize it. Time can also
- 11 -<br />
be synchronized by pressing button “Synchronize system time” in “System menu” in<br />
tab “Modules”.<br />
The default time of monitoring system unit is GMT time zone. In order to convert time of<br />
the master unit into current time zone, select the corresponding time zone in field “Time<br />
zone” in tab “Network” of web-interface and press the button “Save and close”.<br />
1.4 Connection and removal of extension units and sensors<br />
Connecting and removal of extension units and sensors is a simple procedure.<br />
Connection and removal of the extension units<br />
To connect extension unit, follow:<br />
1. Connect UTP patch cable supplied to one of two inputs on the extension unit.<br />
Attention! If strong electromagnetic interference is present, we recommend to use FTP patch<br />
cable!<br />
2. Plug the other end of the cable into RS-485 input of master unit or into any<br />
other extension unit. Determining the type of unit and connection will be automatic.<br />
It is possible to connect up to 30 extension units.<br />
3. To remove a unit disconnect it from the line of extension units.<br />
Connection of analog sensor<br />
In order to connect an analog sensor follow:<br />
1. Connect supplied RJ11 (6P4C) cable to input of analog sensor.<br />
2. Connect the other end of the cable to 6P4C input (I/O «Analog sensors») of<br />
any system unit. Sensor type is determined automatically.<br />
3. Make sure that the sensor is found by the monitoring system. Go to tab<br />
«Modules» in system web-interface. Find the newly connected sensor. Change<br />
sensor settings (see below) if necessary.<br />
4. Repeat procedures 1-3 for the remaining analog sensors, connecting each<br />
sensor to separate analog port.<br />
5. In tab “Modules” press «Save», in order to save data about the connected<br />
units and their parameters.<br />
Several analog sensors, such as contact sensor and smoke sensor (see above Sensors) have<br />
an additional RJ11 output and can be connected consistently into a circuit. However, the<br />
monitoring system distinguishes it and shows them as one sensor!<br />
Attention! In the presence of strong electromagnetic interference, we recommend to use 2-pair<br />
FTP cable for connection of any sensors!<br />
<strong>User</strong> <strong>Manual</strong>
- 12 -<br />
Connection of digital sensor<br />
In order to connect digital sensor follow:<br />
1. Connect supplied RJ11 (6P4C) cable to input of digital sensor.<br />
2. Connect the other end of the cable to digital input 6P4C (Connectors «DI-1,<br />
DI-2») of any system unit or into a free connector of another digital sensor already<br />
connected to the system. Sensor type is determined automatically.<br />
3. Make sure that the sensor is found by the monitoring system. Go to tab<br />
«Modules» in system web-interface. Find the newly connected sensor. Change<br />
sensor settings (see below) if necessary.<br />
4. Repeat procedures 1-3 for the remaining digital sensors, connecting each<br />
sensor to a separate digital port or any other free port of another digital sensor<br />
connected to the system.<br />
Attention! You can connect up to 10 digital sensors consequently to one digital port.<br />
5. In tab “Modules” in “System menu” press «Save», in order to save data<br />
about the connected units and their parameters.<br />
Removal of analog and digital sensors<br />
For removal of sensor disconnect it from the unit. Sensor will not disappear from the<br />
system and will be shown as “Not connected”. At successive connection of the sensor it<br />
is not required to repeat procedure again, all the parameters will be stored in flash memory.<br />
For a complete removal of the sensor, press “Save” in “System menu” of system webinterface;<br />
sensor will be completely removed.<br />
1.5 Connection of devices to relay outputs<br />
For connection of devices to relay it is required:<br />
1. Connect commutative power to connector of relay output.<br />
2. Connect electric load to connector of relay output.<br />
3. Plug the connector into corresponding jack of relay output.<br />
Attention! Devices must only be connected to relay outputs without electric load!<br />
Since the relay is a part of unit, it is connected automatically and does not require any actions<br />
from the administrator.<br />
Keep in mind that when using monitoring system Sky Control as an access control system,<br />
readers are logically related to the first and the second relay outputs.<br />
<strong>User</strong> <strong>Manual</strong>
- 13 -<br />
1. 6 Connection of reader<br />
Pic. 1.5: No reader<br />
Pic. 1.6: Reader connected<br />
The readers can be connected to any digital input ( «DI-1, DI-2») of any monitoring<br />
system module. The reader is automatically detected. The system program will associate<br />
certain embedded relay to each reader. Bus DI-1 is associated with the relay RLY 1, bus<br />
DI-2 with relay RLY 2. And relay to which the reader is connected changes its own algorithm<br />
as follows: at connection of a key or card to reader, the relay switches contacts. The<br />
icon of the relay in tab «Modules» will change as follows:<br />
Connection of I-Touch Button reader<br />
Readers I-BUTTON have two wires.<br />
• ground<br />
• data wire<br />
GND of reader I-BUTTON is connected to the GND pin on the connector RJ11.<br />
Data wire of reader I-BUTTON is connected to the BUS contact on the connector RJ11.<br />
In order for the monitoring system to detect the connection of a reader, NC contact on the<br />
connector RJ11 should be connected using resistor 27K to the GND. Readers can only be<br />
connected to the digital outputs in modules 5500824, 5510824, 5505814, 5505816.<br />
Connection of Proximity reader<br />
Usually Proximity Readers have inputs for<br />
• power supply<br />
• ground<br />
• data wire<br />
Proximity reader’s GND is connected to the GND pin on the connector RJ11. Proximity<br />
reader’s data wire is connected to the contact BUS on the connector RJ11. Proximity<br />
reader’s power connects to the +12V pin on the connector RJ11.<br />
In order for the monitoring system to detect the connection of Proximity reader,<br />
NC contact on the connector RJ11 should be connected to the GND using resistor 27K.<br />
<strong>User</strong> <strong>Manual</strong>
- 14 -<br />
All I-Button keys have a unique identifier, in the same way as Proximity cards.<br />
It is possible to use input readers and keys iButton and Proximity simultaneously in one<br />
access system provided there is a sufficient quantity of digital inputs on units. System<br />
allows to easily add new keys or cards to database of authorized persons by a simple touch<br />
to the input reader. System stores data about entries in the system log, which has several<br />
filters (by name or time), and which allows to quickly find data of a certain user.<br />
Adding key to user database<br />
The monitoring system allows you to control certain user access to certain premises. To<br />
configure the monitoring system to control access you need a module having connectors<br />
«DI-1, DI-2» and relay outputs, a reader and a few keys or cards.<br />
To configure user database, follow:<br />
Pic. 1.7: RJ-11 pinouts<br />
1. Make sure that the master unit is connected to a power source and operates<br />
(Pwr LED on the front panel is on).<br />
2. Plug the reader into one of the free connectors «DI-1, DI-2».<br />
<strong>User</strong> <strong>Manual</strong><br />
Pic. 1.8: Tab «<strong>User</strong> database»
- 15 -<br />
3. Make sure that the reader is detected by the system. To do this, open the<br />
system interface, go to tab «Modules» and locate the relay whose icon shows the<br />
key.<br />
4. Go to the «<strong>User</strong> database» tab. Click “Add Key” button. A dialog window<br />
will appear for entering keys.<br />
5. Touch the reader with the new key or with card. The dialog window will<br />
disappear, and a new key will appear in the list of keys in tab “<strong>User</strong> database”.<br />
6. The relay which corresponds to the connector to which the reader is connected<br />
will turn on for a few seconds (the length of the inclusion is adjustable in<br />
parameters of the relay).<br />
7. Click on the new key in the list. You will be asked to enter user name. Enter<br />
name and click “OK”. Now a new key or card will be matched with the user.<br />
8. Repeat procedures 5-7 for the other keys or cards.<br />
9. Connect the door lock to the relay, take the reader outside the door.<br />
10. When the user key will touch the reader the relay will include contacts for a<br />
few seconds, the name of the user who passed through the door will appear in tab<br />
«System log».<br />
11. If you do not save the key database, at any resetting of power the database<br />
with all the keys will be lost. Make sure to save the user database in system flash<br />
memory. For this purpose, please:<br />
Attention! In order to save settings in Flash memory it is necessary to press “Save” in “System<br />
Menu” in tab “Modules” of monitoring system’s interface.<br />
12. In order not to lose the user database after an accidental loss of monitoring<br />
system or system failure, save it into a file. To do this, click «Download user<br />
database» in tab “<strong>User</strong> database”. You will be asked to save file. Select a folder<br />
and file name, click «Save», remember the path and file name.<br />
13. To restore or to duplicate a database of keys, click «Upload userlist» in<br />
the window “<strong>User</strong> database” to upload the database into the monitoring system.<br />
Click on «Save» in “System menu” in order to save the keys in system flash<br />
memory.<br />
1.7 Saving system configuration settings<br />
The system allows you to save configuration settings into a file for the consequent use.<br />
This option can be useful when you need to set, replicate or restore the system settings. To<br />
save the settings, follow:<br />
1. Open tab “Modules” in the system interface. Go to “System Menu”.<br />
2. Click on “Download system settings”. A dialog box will appear. Save the<br />
backup file on the hard drive of your PC.<br />
<strong>User</strong> <strong>Manual</strong>
- 16 -<br />
To set or restore the system settings, using the previously downloaded backup file, follow<br />
these steps:<br />
1. Put USB flash drive into USB-port on computer.<br />
2. Copy backup file to the flash drive system root.<br />
Attention! Do not change file name.<br />
3. Take out flash drive from the port of your computer and connect it to the<br />
USB port on master unit.<br />
4. Make sure that master unit is connected to a power source and operates (<br />
indicator PWR is on).<br />
5. Prg LED will blink in a few seconds and then will go out.<br />
6. Remove Flash drive. Settings are established.<br />
<strong>User</strong> <strong>Manual</strong>
System setting<br />
Setting of monitoring system includes several separate procedures:<br />
1. setting system log;<br />
2. setting system interface;<br />
3. setting parameters of sensors;<br />
4. setting notifications, timers and web-cameras;<br />
5. adding keys to the user database;<br />
6. changing system logic;<br />
7. creating logic groups.<br />
2.1 Setting system log<br />
Viewing system log<br />
- 17 -<br />
All changes in sensor states, notifications on carrying out actions of logic circuitry, other<br />
important events are displayed in the system log of monitoring system. To view the log,<br />
go to tab “System log” in the web-interface of system.<br />
In order to save the system log on PC hard disk, press button “Save”. Dialog window<br />
will appear, select file name and save the system log. Type of file saved - RSS 2.0 (http://<br />
en.wikipedia.org/wiki/RSS).<br />
Storing log messages of FTP server/Syslog server<br />
Sky Control system allows you to store log messages on your local server or in Internet.<br />
The system supports FTP and Syslog protocols and can send messages to this remote<br />
server for both protocols. In order to setup this follow:<br />
1. Open tab “Modules” in the system interface. Go to “Network”.<br />
2. Type in the address of the remote server on which you want the messages to<br />
be stored in the corresponding fields:<br />
a) In order to store messages on Syslog server type in the IP-address or the name<br />
of the remote server in field “Syslog server address”.<br />
<strong>User</strong> <strong>Manual</strong><br />
Network settings
- 18 -<br />
b) In order to store messages on remote FTP server, type in the name of the<br />
server, including the username and password in the field “FTP server address<br />
where log messages are to be stored permanently...”. FTP server may require<br />
authorization, in this case make sure you fill in the field correctly in the form:<br />
ftp://login:password@hostname:port/path<br />
Where:<br />
login and password - the name of the user and password to access FTP server,<br />
this user must have the rights to save files in server.<br />
hostname and port - IP-address or the domain name and the port of the remote<br />
server respectively. If port is not typed in, FTP port (21) is used by default.<br />
path - the path to the folder in which the system will store the log messages.<br />
When storing the system log on remote FTP server, the monitoring system uses passive<br />
mode, i.e. only the server opens up ports for incoming traffic.<br />
When storing the system log on remote FTP server, the system does not instantly save the<br />
data in the remote server, firstly it buffers the information to reduce frequency of saving<br />
data to the server. Log entries are recorded at intervals of 5 minutes.<br />
The format of the file used to save the log to FTP server contains the name of the system<br />
log ( Sky Control), IP-address of the system from which the log must be stored, and the<br />
date when the log was created. Each time the day changes (at 00:00) the monitoring system<br />
creates new file in the remote sever. The name of the file is as follows:<br />
Sky-control-192.168.1.193-2010-03-28.log.<br />
3) Press “Save and close”.<br />
4) Reboot the system to apply changes.<br />
Attention! The changes made to the Syslog and FTP server parameters will take effect only after<br />
rebooting the system of monitoring.<br />
2.2 Variable interface settings<br />
Tab «Settings» of the web-interface allows to set the following:<br />
1. Interface language. To change interface language, select the language you<br />
need and refresh your browser.<br />
2. Ability to play sound when there is a new event or there is an unread log<br />
entry. If you enable this option, the sound will play through speakers.<br />
3. Icon size. Simply move the mouse over and sensor icon size will change.<br />
4. Reload timeout. Speed with which information is updated in the interface.<br />
To reduce the use of network, increase this value<br />
<strong>User</strong> <strong>Manual</strong>
- 19 -<br />
Pic. 2.1: Settings window<br />
2.3 Setting parameters of sensors, sensor threshold levels<br />
Go to tab “Modules” in the interface of monitoring system, select element whose parameters<br />
need to be altered. (Sensor must be connected).<br />
Setting temperature, humidity, voltage sensors<br />
Pic. 2.2 shows the window for changing parameters of this type of sensor. Each sensor<br />
has 4 logic conditions:<br />
• Low level(Low) – if value of indications of the sensor is not above Low Level:<br />
• Norm (Normal) – if value of indications of the sensor is between Low Level and<br />
Warning Level:<br />
• High level (Warning) – if value of indications of the sensor is between Warning<br />
Level and Alarm Level:<br />
• Alarm (Alarm) – if value of indications of the sensor is not below Alarm Level:<br />
<strong>User</strong> <strong>Manual</strong>
- 20 -<br />
Pic. 2.2: Adjusting sensor threshold levels<br />
The administrator has the opportunity to set the following sensor parameters:<br />
• Sensor Name - the name of the sensor, which will be displayed in the interface,<br />
in system log, etc.<br />
• Levels of alarm.<br />
○ Low level. If value of indications of the sensor is not above the given<br />
threshold, the sensor switches to logic condition “Low level”.<br />
○ Warning level. If value of indications of the sensor is above the given<br />
threshold, the sensor switches to logic condition «High level».<br />
○ Alarm level. If value of indications of the sensor is above the given<br />
threshold , the sensor switches to logic condition «Alarm».<br />
In order to set the threshold levels move them with mouse. Press “Apply” for changes in<br />
threshold levels to come into effect. However, threshold levels will not be saved in flash<br />
memory of system! If power supply is lost, threshold levels will be lost.<br />
Attention! In order to save settings in Flash memory it is necessary to press “Save” in “System<br />
Menu” in tab “Modules” of monitoring system’s interface. In this case all your settings<br />
will be restored if power supply will be lost.<br />
The administrator has an opportunity to control the condition of the sensor from webinterface:<br />
• If you click on sensor icon, window will open.<br />
• “Sensor name” allows you to write the name of sensor.<br />
• Logic condition of sensor is shown in the field “Sensor state”.<br />
<strong>User</strong> <strong>Manual</strong>
- 21 -<br />
• Sensor data is shown in the field “Value”. If the field shows «Not connected»,<br />
the sensor is disconnected from the connector or is defective.<br />
• The two links in field “Save current system state and data in data file” allow<br />
to export gathered sensor data in the format of CSV and XML for a period of<br />
time up to 3 months. This exported data can be easily opened in a program that<br />
supports tables, for example «Open Office Math» or «Microsoft Excel», and<br />
then can be used to perform required calculations or to be saved in the database<br />
(Pic 2.3).<br />
• Field «Response date» displays time of last reading of sensor level by the interface<br />
in monitoring system.<br />
• Field «Levels» evidently displays the established logic levels of the sensor, as<br />
well as its current data.<br />
• You may also set the “Plot period”. The longer the period the less readings are<br />
taken and the less memory is required to store data.<br />
• To save all the settings, name, thresholds and periods in system memory, click<br />
“Apply” and click “Save” button in “System Menu” in tab “Modules”!<br />
Pic. 2.3: Performing calculations in Excel<br />
• Plot displays dynamics of changes of sensor’s indications in the last hour, last<br />
3 days or last three months. In order to alter the graph’s time period select the<br />
required period in menu “Plot period” ( Pic. 2.4).<br />
<strong>User</strong> <strong>Manual</strong>
- 22 -<br />
Pic. 2.4: Selecting plot period<br />
Plot may not be displayed, if the monitoring system has no indications of the sensor, or<br />
if their duration is less than 1 minute. Such situation can arise, if less than 1 minute has<br />
passed from the moment the sensor or the unit was connected, or after synchronization of<br />
time.<br />
Pic. 2.5: Multiple plot<br />
The administrator has opportunity to view dynamic changes of several sensors. To do that<br />
press “Multiplot” and select the required sensors from the list. The list of available sensors<br />
contains only temperature, humidity and voltage sensors. The time period of display<br />
can also be changed.<br />
<strong>User</strong> <strong>Manual</strong>
- 23 -<br />
The multiple plot has two Y-axis (Pic. 2.5). The left Y-axis shows joint temperature ( in<br />
ºC) and humidity (in %), the right Y-axis shows voltage (V).<br />
Setting other sensors<br />
Other sensors that are not described in the previous section, have two conditions:<br />
• Normal - if the sensor operates in the normal mode, the given level corresponds<br />
to the open contact (the button is not pressed, the smoke is absent, the door is<br />
closed etc.). If the sensor operates in the reversed mode - the given level corresponds<br />
to the closed contact.<br />
• Alarm - if the sensor operates in the normal mode, the given level corresponds to<br />
the closed contact (the button is pressed, the smoke is present, the door is closed<br />
etc.). If the sensor operates in the reversed mode - the given level corresponds to<br />
the open contact.<br />
<strong>User</strong> <strong>Manual</strong><br />
Pic. 2.6: Window opened for contact sensor<br />
The administrator has opportunity to set the following parameters for the given type of<br />
sensor (Pic. 2.6):<br />
• Sensor name - the name of the sensor under which it will be displayed in the<br />
interface, in system log, etc<br />
• Reverse alarm signal - use of reverse operating mode. In reverse mode the sensor<br />
switches to "Alarm" level if contact is opened (the button is not pressed, the<br />
smoke is absent).<br />
Press "Apply" for changes to come into effect. However, the changes will not be saved in<br />
flash memory of system! If power supply is lost, threshold levels will be lost.<br />
Attention! In order to save settings in Flash memory it is necessary to press “Save” in “System<br />
Menu” in tab “Modules” of monitoring system’s interface. In this case all your settings<br />
will be restored if power supply will be lost.
- 24 -<br />
The administrator has opportunity to control sensor's state from web-interface:<br />
• Field «Sensor state» corresponds to current logic level of element.<br />
• «Value» displays sensor state. If the field shows «Not connected», the sensor is<br />
disconnected from the connector or is defective.<br />
• Field «Response date» displays time of last reading of sensor level by the interface<br />
in monitoring system<br />
Setting relay<br />
Pic. 2.5: Multiple plot<br />
Each relay has two states:<br />
• On;<br />
• Off.<br />
Depending on status of relay, certain pair of contacts of the corresponding relay is closed<br />
on the system panel.<br />
The administrator can set the following parameters of the relay (Pic. 2.7):<br />
• Sensor name - the name of the sensor under which relay will be displayed in the<br />
interface, in system log, etc<br />
• Pulse duration - duration of the relay being in condition "switched on" at submission<br />
of impulse on the relay.<br />
• Default state - the condition to which the relay switches at connection of unit<br />
and when the operating logic circuitry that switches the relay is absent.<br />
Press "Apply" for changes to come into effect. However, the changes will not be saved in<br />
flash memory of system! If power supply is lost, threshold levels will be lost.<br />
Attention! In order to save settings in Flash memory it is necessary to press “Save” in “System<br />
Menu” in tab “Modules” of monitoring system’s interface. In this case all your settings<br />
will be restored if power supply will be lost.<br />
<strong>User</strong> <strong>Manual</strong>
- 25 -<br />
2.4 Setting notifications<br />
Monitoring system allows to notify the administrator about the occurred events in four<br />
different ways:<br />
1. Notification via e-mail (e-mail alerts);<br />
2. Notification via SMS;<br />
3. Notification through UDP (SNMP Trap);<br />
4. Notification via ICQ/AIM.<br />
Notification via e-mail (E-mail alerts)<br />
The element "E-mail alert " is used to notify the administrator about the events occurring<br />
in system by sending an e-mail.<br />
Using logic circuitry (see below) monitoring system allows to describe any set of states<br />
of sensors present in system, of which it is necessary to inform the administrator using<br />
given e-mail address. By means of elements "E-mail alert" recipients of messages are<br />
configured, as well as parameters of server's mail from which messages will be sent by this<br />
element.<br />
In order to create such alert:<br />
1. Go to tab "Modules" in the web interface of monitoring system.<br />
2. Select menu item "Add mailer" in "System menu". A form will appear for<br />
filling in ( Pic. 2.8).<br />
3. In the field «Notification type» select «E-mailer».<br />
4. Fill in the fields of the form. All the fields are obligatory for filling in.<br />
<strong>User</strong> <strong>Manual</strong><br />
○ Name - name of the element under which it will be displayed in the interface,<br />
in system log, etc<br />
○ SMTP server - mail client. Correctly adjust network parameters of master<br />
unit in order for server to be accessible.
- 26 -<br />
○ SMTP port - SMTP-port on server, normally 25.<br />
○ Login - name of the user for authorization on server.<br />
○ Password – password for authorization on server.<br />
○ Mail to - administrator's e-mail to which the notification will be sent.<br />
○ Mail from - e-mail which will be shown in the field "From" in the message<br />
received by the administrator.<br />
○ Message format - he format of the e-mail message can be specified by the<br />
administrator. Format of the message is as follows: « Logic circuit %1 has<br />
worked. Conditions of sensors: %2, current time %3 ». The message can<br />
contain the following fields:<br />
%1 – description of the logic scheme that came into action (see below);<br />
%2 – sensor data, included in the logic scheme;<br />
%3 – time of response of the logic scheme ;<br />
%4 – name of logic scheme<br />
5. Press button «Send test message» to test the element.<br />
6. Press button «Save and close».<br />
The created notification will appear in the list of modules and sensors in tab “Modules” in<br />
web interface. Notification will be seen only in modes «View groups» or «View map».<br />
Attention! In order to save settings in Flash memory it is necessary to press “Save” in “System<br />
Menu” in tab “Modules” of monitoring system’s interface. In this case all your settings<br />
will be restored if power supply will be lost.<br />
<strong>User</strong> <strong>Manual</strong><br />
Pic. 2.9: New notification<br />
Notification via SMS - installation and configuration<br />
of GSM-modem<br />
The monitoring system can send notifications via SMS after you have installed and configured<br />
GSM modem. To configure the GSM modem, follow these steps:<br />
1. Disconnect system power cable from the mains supply.<br />
2. Open the metal case of the system by unscrewing the bolts and removing the<br />
cover.<br />
3. Connect the SIM-card to the modem.<br />
4. Connect modem to the system by two M3 bolts, connect one end of the cable<br />
to port on modem board and the other to the port on the system board.
- 27 -<br />
5. Connect antenna cable to antenna port on the modem board. Put the other<br />
end of the cable with jack through a round hole in the metal case of the system,<br />
connect antenna to the antenna jack from the outside of the metal case.<br />
6. Close the metal case using the bolts and connect the system power cable.<br />
Once the modem is connected to the system, it will automatically detect it and GSMmodem<br />
icon will appear in the web interface in tab “Modules”, you can configure your<br />
modem by clicking on its icon (see Pic. 2.9.1).<br />
Pic. 2.9: New notification<br />
Once the modem was connected and automatically detected, it has to be configured. To<br />
configure the settings follow these steps:<br />
1. Click on modem icon.<br />
Pic. 2.9.2: GSM modem configuration<br />
<strong>User</strong> <strong>Manual</strong>
- 28 -<br />
2. Type in PIN-code of the SIM card if needed in the opened window. See Pic.<br />
2.9.2.<br />
3. Type in the number of the SMS service centre.<br />
4. Type in the telephone numbers from which you will send the commands to<br />
the system remotely. Only these telephone numbers will be able to send commands!<br />
It will not be possible to carry out these actions from any other phone<br />
number.<br />
5. Press “Save and close” to save settings.<br />
Remote control of monitoring system using SMS-commands<br />
Monitoring system with installed GSM-modem has the ability to remotely receive and<br />
carry out commands sent from mobile phones. In order to use SMS-commands, the following<br />
steps are required:<br />
1. Make sure your monitoring system is turned on and is running, GSM modem<br />
must be connected to the system and detected by it.<br />
2. Check the modem settings by clicking on modem icon in tab “Modules”.<br />
Network status must be “Registered in GSM network”, signal level must not be<br />
equal to 0%. See pic. 2.9.2<br />
3. The phone number from which the command will be sent must be present in<br />
the field “Phone numbers to command the system”.<br />
If all of the above are correct the following commands can be received by the system.<br />
get SENSOR-ID<br />
Command: reading sensor parameters<br />
This command checks the state of the sensor or relay (outlet) and sends response SMS to<br />
the phone, from which the command was sent, with the sensor state data. SENSOR-ID<br />
can be the name of the sensor or its number.<br />
get outlet-00-1<br />
When this command is sent to the GSM modem phone number it will automatically send<br />
a response SMS to the phone number from which the command was sent, with either<br />
“ON” or “OFF” depending on the state of relay.<br />
Command: setting state of relay/outlet<br />
set SENSOR-ID STATE<br />
This command will switch on or off relay or outlet depending on STATE parameter.<br />
SENSOR-ID can be the name of the sensor or its number. STATE can be ON if relay<br />
must be switched on, or OFF if must be switched off. For example, command<br />
<strong>User</strong> <strong>Manual</strong>
- 29 -<br />
set outlet-00-1 on<br />
Will switch on outlet-00-1 in monitoring system.<br />
Notification via SMS<br />
In order for the system to be able to send SMS notifications, GSM modem must be installed<br />
and configured, notification must be created. The element «SMS message» is used<br />
for notification using GSM-network. The SMS alert is only possible if GSM modem is<br />
embedded into the system. If GSM device is not installed in monitoring system, sending<br />
SMS will not be possible.<br />
In order to create SMS notification follow:<br />
1. Go to tab «Modules» in the web-interface of monitoring system.<br />
2. Press «Add mailer» in "System menu". A form for creating new notification<br />
will appear.<br />
3. In the field «Notification type» select «SMS message».<br />
4. Fill in the name of notification and the phone number using (+) not (0)! The<br />
default message will only contain the name of the logic circuitry and the time of<br />
notification.<br />
5. Press button «Send test message» to test the element.<br />
6. Press button «Save and close». If you see error message «GSM-modem is<br />
not installed», check your modem settings and refresh your browser.<br />
The created notification will appear in the list of modules and sensors in tab<br />
"Modules" in web interface. Notification will be seen only in modes «View<br />
groups» or «View map».<br />
7. Go to tab «Network».<br />
8. In field «SMS service center address» type in the phone number of the corresponding<br />
center starting the phone number with (+).<br />
9. Press button «Save and close».<br />
Attention! In order to save settings in Flash memory it is necessary to press “Save” in “System<br />
Menu” in tab “Modules” of monitoring system’s interface. In this case all your settings<br />
will be restored if power supply will be lost.<br />
Notification through UDP (SNMP Trap)<br />
The element «SNMP trap» uses TRAP-message of SNMP protocol to notify the administrator<br />
about the events occurring in system.<br />
Using logic circuitry (see below) monitoring system allows to describe any set of states of<br />
sensors present in system, of which it is necessary to inform specific SNMP-manager (via<br />
given IP). By means of this element recipients of messages are described.<br />
<strong>User</strong> <strong>Manual</strong>
- 30 -<br />
In order to create such notification:<br />
1. Go to tab «Modules» in the web-interface of monitoring system.<br />
2. Press «Add mailer» in "System menu". A form for creating new notification<br />
will appear.<br />
3. In the field «Notification type» select «SNMP-trap».<br />
4. Fill in the fields of the form. All fields are obligatory for filling in.<br />
5. Press button «Send test message» to test the element.<br />
6. Press button «Save and close».<br />
Created notification will appear in the list of notifications in tab "Modules" in the webinterface.<br />
To show new notification display mode should be «View groups» or «View<br />
map».<br />
Attention! In order to save settings in Flash memory it is necessary to press “Save” in “System<br />
Menu” in tab “Modules” of monitoring system’s interface. In this case all your settings<br />
will be restored if power supply will be lost.<br />
Notification via ICQ or AIM<br />
The element «AIM/ICQ notifications» uses ICQ-message to notify the administrator<br />
about the events occurring in system.<br />
Once you have set up notification, specify the recipient list who will receive notifications,<br />
each user from the list of recipients will receive a copy of system log. Thus, each user<br />
from the list of recipients will be immediately notified about the events via ICQ.<br />
To create AIM/ICQ notifications you need an ICQ or AIM account, which will be free of<br />
use during running of the system. In order to create such notification:<br />
1. Go to tab «Modules» in the web-interface of monitoring system.<br />
2. Select menu item «AIM/ICQ notifications» in "System menu". A form for<br />
creating new notification will appear (Pic. 2.10).<br />
3. In the field «Subscription list» enter new recipients: ICQ numbers or AIM<br />
names. These accounts will receive notifications.<br />
4. Fill in the field «AIM/ICQ account login», type in the «Account password»<br />
of the monitoring system.<br />
5. Press button «Save and close».<br />
<strong>User</strong> <strong>Manual</strong>
- 31 -<br />
<strong>User</strong> <strong>Manual</strong><br />
Pic. 2.10 :AIM / ICQ settings<br />
After you click "Save and Close", the system tries to connect to the AIM/ICQ server. If<br />
the connection is established (ICQ server is available, password and login are correct), the<br />
system will send notification to recipients, and AIM/ICQ account registered for this system<br />
will go on-line. System log will record successful login to the AIM/ICQ server.<br />
If registering AIM/ICQ account was unsuccessful the system log will show registration<br />
failure and error code. The most common error is an incorrect password.<br />
Attention! In order to save settings in Flash memory it is necessary to press “Save” in “System<br />
Menu” in tab “Modules” of monitoring system’s interface. In this case all your settings<br />
will be restored if power supply will be lost.<br />
Removal of notifications<br />
To remove notification, click on it in tab "Modules". A form of changing notification<br />
parameters will appear. Press button "Delete". Notification will be removed.<br />
To remove an AIM/ICQ notification, click on ICQ icon, and erase your login name and<br />
account password. Once you erased the login name and account password click "Save<br />
and Close», the notification will be disabled.<br />
In order to save settings in Flash memory it is necessary to press "Save" in “System<br />
Menu” in tab "Modules" of monitoring system's interface.<br />
Сontrol of monitoring system using ICQ<br />
Sky Control monitoring system allows the user to receive information about the state of<br />
sensors and to manage outlets via ICQ and AIM services. In order to send such remote<br />
commands, the user must follow the instructions described above on how to set up ICQ<br />
notifications. After these are properly set up, it is possible to send commands from ICQ to<br />
the system, in response to which it will send certain data. The following commands can be<br />
processed by the system:
- 32 -<br />
Pic. 2.10.1: Sending commands to monitoring system from ICQ<br />
• log - this command will ask the monitoring system for the latest messages in the<br />
system log.<br />
• list - this command will ask for the list of all sensors connected to the system, as well<br />
as the list of all outlets (relays) connected.<br />
• get - this command will ask for readings of one of the sensors or outlets connected to<br />
the system. One such parameter can be for example the name of sensor, whose state<br />
is needed to be checked. Example of such command:<br />
get outlet-00-1<br />
In response to this command the monitoring system will send message with the current<br />
state of the outlet Outlet-00-1 as follows:<br />
Outlet-00-1: off<br />
• set — this command will ask the system to change the state of outlet. It requires two<br />
parameters – the name of outlet, whose state has to be changed, - the new state to<br />
which it must be changed. Parameter “New state” can be on/off. Example of such<br />
command:<br />
set outlet-00-1 on<br />
<strong>User</strong> <strong>Manual</strong>
- 33 -<br />
In response to such command the system will change the state of relay to “ON” and<br />
will send the following message:<br />
“The outlet was switched on”<br />
2.5 Setting timers<br />
The monitoring system allows you to perform certain tasks at a certain intervals with a period<br />
of 1 day or 1 week, or once. This mechanism is implemented with the help of virtual<br />
sensor-timers. Each timer in the monitoring system can be set to “Norm” when it’s not<br />
activated and “Alarm” when activated. Thus, administrator has possibility to customize<br />
the logic of the monitoring system, taking into account the day of the week or by using the<br />
time period (see below, Logic).<br />
Adding timer<br />
In order to add timer, follow these steps:<br />
Pic. 2.11: Adding timer<br />
1. Go to tab «Modules» in the interface of monitoring system.<br />
2. Press on menu item «Add timer» in "System menu". A form for creating<br />
new timer will appear ( Pic. 2.11).<br />
3. Select the timer mode - "Weekly" or "Once". If you select "Once", then the<br />
timer will react only once.<br />
4. Fill in the fields of the form name, start time and end time. All fields are<br />
obligatory for filling in. For “Once” mode you will need: start time YYYY-MM-<br />
DD HH:MM format, end time: YYYY-MM-DD HH:MM format. For "Weekly"<br />
mode: start time HH:MM format, end time HH:MM format. Year, month, day,<br />
hour and minute respectively.<br />
5. If you selected "Weekly" mode, tick the days on which timer should be<br />
activated.<br />
6. Press button «Save and close».<br />
<strong>User</strong> <strong>Manual</strong>
- 34 -<br />
Created timer will appear in the list of sensors in tab "Modules" in the web-interface. To<br />
show new notification display mode should be «View groups» or «View map».<br />
Attention! In order to save settings in Flash memory it is necessary to press “Save” in “System<br />
Menu” in tab “Modules” of monitoring system’s interface. In this case all your settings<br />
will be restored if power supply will be lost.<br />
Removal of Timer<br />
To remove "Timer", click on it in tab "Modules". A form of changing timer parameters<br />
will appear. Press button "Delete". Timer will be removed. In order to save changes in<br />
Flash memory it is necessary to press "Save" in “System Menu” in tab "Modules" of<br />
monitoring system's interface. In this case all your settings will be restored if power supply<br />
will be lost.<br />
2.6 Ping service<br />
Monitoring system has an automatic ping service. It can automatically check a remote<br />
host for availability. When you add several IP addresses you will be able to control remote<br />
hosts availability and round-trip time. Monitoring system can take specific actions if<br />
responses are not sent.<br />
Adding server to ping<br />
Pic. 2.12: Adding ping request<br />
1. Go to tab «Modules» in the interface of monitoring system.<br />
2. Press on «Add server to ping» in "System menu". A dialog box will open ( Pic.<br />
2.12).<br />
3. Type in IP address or the name of server to ping, for example www.skycontrol.com.<br />
4. Select echo request period (default period 3 seconds) and estimated round-trip time.<br />
5. Press “Save and close”.<br />
<strong>User</strong> <strong>Manual</strong>
- 35 -<br />
After you press “save and close”, new server will be added to system and you will see it<br />
in tab “Modules”. If you click on server icon you can see additional information about the<br />
server such as average echo-timeout, packets sent.<br />
Attention! In order to save settings in Flash memory it is necessary to press “Save” in “System<br />
Menu” in tab “Modules” of monitoring system’s interface. In this case all your settings<br />
will be restored if power supply will be lost.<br />
Removal of ping request<br />
To remove ping request select it from the list of sensors in tab “Modules”. Dialog<br />
window will open where you can edit it. Click on “Delete” button. Ping request will be<br />
removed. In order to save changes in Flash memory it is necessary to press "Save" in<br />
“System Menu” in tab "Modules" of monitoring system's interface. In this case all your<br />
settings will be restored if power supply will be lost.<br />
2.7 Application of maps and plans of object<br />
The Sky Control monitoring system gives opportunity to virtually assign specific sensors<br />
to a certain object inside the premises or other object. This allows quick determination of<br />
sensor's location in room or in office, determine the location of an alarming event simply<br />
by a quick glance on the map.<br />
Creating or changing object map<br />
Monitoring system has a default map of object. In order to upload your own map the following<br />
steps are required:<br />
1. Go to tab «Modules» in monitoring system web-interface.<br />
2. Select mode «View map», see (Pic. 2.13).<br />
3. Press link «Change». Click «Upload» in the dialog box.<br />
4. File window will appear. Select the required image and click «Open»<br />
Attention! The system only supports JPEG, PNG and GIF images which do no exceed 5 Mb.<br />
5. Selected file to be uploaded to monitoring system. This can take some time<br />
if Internet connection is slow.<br />
6. Tab “Modules” of monitoring system will be automatically updated after the<br />
image was uploaded and you will see the map image.<br />
Assigning sensors to location on map<br />
In order to assign sensor to specific location drag one of the sensors onto the plan image.<br />
(Pic. 2.13)<br />
<strong>User</strong> <strong>Manual</strong>
- 36 -<br />
The location of the sensor on the map will be saved in the monitoring system. In order to<br />
remove the sensor from the map drag it into the group «All elements».<br />
Removal of maps<br />
Pic. 2.13: Assigning sensor to location on a map<br />
In order to remove map, go to tab «Modules» and click on «Change», press button<br />
"Delete". After the removal of map, all the sensors assigned to this image would lose their<br />
specific locations on the map.<br />
2.8 Adding logic circuit<br />
Monitoring system allows the administrator to create logic for the system: to set specific<br />
actions for the executive device (relay) and for the "Notifications" to be taken when a<br />
specific combination of logic conditions of system elements occurs.<br />
Logic circuit is a set of the conditions defining an event, and a set of actions taken by<br />
monitoring system on occurrence of event.<br />
Condition: if sensor changes mode. For example, temperature sensor with name "Temp1"<br />
changes its mode to "Alarm". If there are no other conditions, as soon as sensor "Temp1"<br />
will change to mode "Alarm", an event will take place, defined by the given set of conditions.<br />
Conditions are united in set of conditions inside of a logic circuit by means of logical<br />
operations AND/OR.<br />
Action is transition of specific executive device (relay) into the given condition or actualization<br />
of the specific element from group "Notifications". Actions are united in a set of<br />
actions by means of logical operation AND.<br />
Monitoring system allows to specify conditions and to set actions. Created logic circuit<br />
can be found in tab "Logic schemes" of system web-interface (Pic. 2.14).<br />
<strong>User</strong> <strong>Manual</strong>
- 37 -<br />
Pic. 2.14: Tab “Logic schemes” of web-interface<br />
Creation of logic circuit<br />
To create a logic circuit the following actions are required:<br />
1. Go to tab «Logic schemes» of monitoring system web-interface.<br />
2. Press button «Add logic». A form will appear for creation of logic circuit<br />
(Pic. 2.15).<br />
3. Select a set of conditions, choosing required sensors and their states, for<br />
actions to be taken.<br />
1. Create set of actions, choosing executive device (relay) or notification and<br />
action produced by it that have to meet the conditions.<br />
2. Press «Save and close». Newly created logic circuit will appear in the list of<br />
logic circuitry in tab "Logic schemes" in the web-interface.<br />
Monitoring system checks the give logic circuit at each inquiry of connected sensors.<br />
<strong>User</strong> <strong>Manual</strong><br />
Pic. 2.15: Creation of logic circuit
- 38 -<br />
Monitoring system checks the give logic circuit at each inquiry of connected sensors.<br />
Testing the logic circuit consists of checking whether the conditions of all logic circuitry<br />
are met. If all give conditions are met, the system creates an action that corresponds to the<br />
given logic circuit. The system carries out these actions only after all logic circuitry has<br />
been tested.<br />
The set of actions of logic circuitry is carried out only during the first event that is specified<br />
in the given logic circuit. If the same event occurs for the given logic circuit at all<br />
subsequent tests by system (at all subsequent inquiries), repeated action will not be carried<br />
out. As soon as this event does not occur after a test of logic, actions corresponding to this<br />
event will be taken again once this event will occur during the consequent test.<br />
Attention! The actions produced by the monitoring system will not be defined, if actions of different<br />
logic circuitry are mutually exclusive!<br />
Removal of logic circuit<br />
In order to remove logic circuit, go to tab "Logic schemes", press button "Delete" opposite<br />
the logic circuit needed to be removed. Press button "Save" in "System menu" to<br />
save changes in flash memory.<br />
2.9 Adding logic groups<br />
Sometimes it is convenient to distribute the elements of system into groups depending on<br />
their attributes.<br />
For example, if one system supervises parameters of two rooms Room1 and Room2, then<br />
it is convenient to divide all the system elements into two groups depending whether they<br />
belong to the first or the second room.<br />
In order to add logic group the following actions are required:<br />
<strong>User</strong> <strong>Manual</strong><br />
Pic. 2.16: Choosing viewing mode
- 39 -<br />
1. Go to tab «Modules» in the web-interface of system.<br />
2. Select mode «View groups» ( See Pic. 2.16).<br />
3. Press the button «Add group», dialog window will appear requesting to<br />
enter the name for logic group and its description. Enter the data and press «OK».<br />
A new logic group is created.<br />
In order to change the list of the elements belonging to certain group, drag the necessary<br />
element from one group to another using mouse ( Pic. 2.17).<br />
Attention! In order to save settings in Flash memory it is necessary to press “Save” in “System<br />
Menu” in tab “Modules” of monitoring system’s interface. In this case all your settings<br />
will be restored if power supply will be lost.<br />
In order to remove group press the button "Modify" opposite to group name in tab<br />
"Modules". Press button "Delete" in the dialog window appeared. Press "Save" in tab<br />
"Modules" of system's web-interface in order to save changes in nonvolatile memory.<br />
Pic. 2.16: Choosing viewing mode<br />
2.10. COM-port remote control<br />
IP server PDU 5510.008 has 8 COM-ports of RJ-45 connector format on its front panel.<br />
If necessary, they are connected to the RS-232 connectors of the corresponding server or<br />
PC using COM-RJ45 cable. The master unit contains tab «COM-port» in the user interface.<br />
(Pic. 2.19)<br />
Tab «COM-port» allows you to control remote computer via LAN or the Internet, if it is<br />
connected to COM-port of IP server PDU, and if the remote computer has program that<br />
controls access to the terminal.<br />
<strong>User</strong> <strong>Manual</strong>
- 40 -<br />
<strong>User</strong> <strong>Manual</strong><br />
Pic. 2.18: Simple serial port remote console window<br />
To configure the remote server for remote control the following steps are required. (Since<br />
different operating systems require to perform different actions, below is an example for<br />
Linux system (Ubuntu)). All the computers that run Unix-based operating systems will<br />
require similar actions.)<br />
1. Make sure that IP server PDU unit 5510.008 is switched on (indicator<br />
«PWR» on the front panel is on), make sure that the server is on and the OS<br />
(Ubuntu Linux) is loaded and running.<br />
2. Connect one end of COM-RJ45 cable to the COM-port on the unit, the other<br />
end to the first COM-port on the server.<br />
3. On the server, open terminal (Alt + Ctrl + F1) and enter command<br />
"sudo while true; do getty -L 115200 /dev/ttyS0“"<br />
This command will set up the first COM-port ( will set speed to 115200 baud, 8<br />
data bits, no parity, and will ignore the signal Carrier Detect (CD)) and will run<br />
the invitation program to login).<br />
4. Open tab «COM-port» in the IP server PDU interface. Set COM-port number<br />
to 1, and speed to 115200 (Pic. 2.19).<br />
5. Enter the username and password, and proceed to work with computer.<br />
6. To shutdown the server remotely , type in:<br />
”sudo shutdown –h now”<br />
To reboot the server remotely, type in:<br />
”sudo shutdown –r now”<br />
7. It is possible to work simultaneously only with one COM-port.
- 41 -<br />
Pic. 2.19: COM-port remote control window<br />
2.11. Connection of USB camera<br />
Sky Control monitoring system allows to connect one USB camera ( web-camera). USB<br />
camera is connected to the USB connector on the front panel of monitoring system. After<br />
the connection of USB camera and after it is found by the system, the system log (tab<br />
“System log”) shows “USB camera found”, and the image of USB-cam appears in tab<br />
“Modules”.<br />
Therefore monitoring system allows remote surveillance over the premises in which the<br />
system is located. To view the image from USB-camera, select corresponding camera icon<br />
in tab "Modules" of system interface. A new window will open where you can change the<br />
image resolution. Although the image is relatively small (JPEG format) it requires fast<br />
Internet. One such image requires from 4 to 12 Kb while the transfer rate can reach up to<br />
<strong>User</strong> <strong>Manual</strong><br />
RJ-45 and COM-port cable
- 42 -<br />
10 images per sec.<br />
2.12 IP Web-cameras<br />
The monitoring system allows to integrate and give access to images of several IP-cameras<br />
in its interface. The system supports wide range of IP-cameras which have the possibility<br />
to transfer images in JPEG format.<br />
Adding IP-camera<br />
To add an IP-camera, follow:<br />
1. Open tab «Modules» in the web-interface of the monitoring system.<br />
2. Select menu item «Add IP-camera» in «System menu». Dialog box will<br />
appear (Pic. 2.20).<br />
<strong>User</strong> <strong>Manual</strong><br />
Pic. 2.20: Adding IP-camera<br />
3. Enter the IP-address of the camera. If IP-camera requires authentication<br />
for access to the interface, enter login name and password in the corresponding<br />
fields.<br />
4. Click on «Search». The monitoring system will attempt to automatically detect<br />
full path to the JPEG image transmitted by camera. If it fails, message of an<br />
unsupported IP-camera will appear. In such case, enter the full path of transmitted<br />
image in the IP-address field ( which can be found in the IP-camera documentation),<br />
e.g. for AXIS IP-cameras the full path is: /jpg/image.jpg.<br />
5. If the monitoring system identifies IP-camera image will appear. Click on<br />
«Save and close» to apply changes.
- 43 -<br />
The newly created IP-camera will appear in the list of units in tab «Modules» of monitoring<br />
system interface.<br />
Attention! In order to save settings in Flash memory it is necessary to press “Save” in “System<br />
Menu” in tab “Modules” of monitoring system’s interface. In this case all your settings<br />
will be restored if power supply will be lost.<br />
Removal of IP-camera<br />
In order to remove IP-camera, select it from the list of elements in tab «Modules» of the<br />
monitoring system. An edit box for the camera will appear. Press button «Delete» on the<br />
bottom of the box. Click on «Save» in «System menu» of system web-interface to save<br />
all changes in flash memory.<br />
2.13 Application of dynamic DNS Update<br />
Updating dynamic IP address on dynamic DNS services<br />
Automatic update of IP-address on dynamic DNS hosting services (http://en.wikipedia.<br />
org/wiki/Domain_Name_System, http://en.wikipedia.org/wiki/Dynamic_DNS) is needed<br />
when monitoring system is used in Ethernet network, which is not directly connected<br />
to Internet. Sky Control system allows to get access to Internet even when working via<br />
dynamic IP-address, which is convenient when using the system at home.<br />
For installation and setting up the following are required: any master unit (e.g. 5500.824),<br />
connection to Internet and router with NAT support, if you are using your Internet connection<br />
through one external dynamic or static IP address set up by your provider.<br />
Setting up router<br />
1. Select static IP address (not used with DHCP) for monitoring system.<br />
2. Assign this address to the monitoring system.<br />
3. Add redirection rules for NAT packets on the router in such manner that<br />
packets going to 80 (8008) and 443 ports of the router were redirected to 80 and<br />
443 ports of monitoring system in the local network:<br />
Server name Protocol External port Internal port Server IP<br />
HTTP TCP 8008 80 IP-adress of monitoring<br />
SSL TCP 443 443 system in local network<br />
4. Application of external 8008 port instead of 80 port may be required since<br />
80 port is commonly blocked by Internet providers<br />
<strong>User</strong> <strong>Manual</strong>
- 44 -<br />
Application of dynamic DNS<br />
Sky Control system supports the following services: http://www.no-ip.com, http://www.<br />
dyndns.com.<br />
For automatic update of IP address follow:<br />
1. Register with one of the services. The required DNS service is provided for<br />
free. Create domain with dynamic DNS as well as:<br />
2. When using service www.no-ip.com:<br />
Select domain and sub-domain, e.g. example.no-ip.com.<br />
Select host type «Port 80 redirect».<br />
Type in the IP-address offered to you, this is your current IP-address.<br />
Type in the port you used when setting up NAT: 8008 or 443.<br />
3. After successful registration adjust automatic update of IP-address of monitoring<br />
system. To do that:<br />
4. Go to tab «Automatically update IP-address» in system interface. (Pic<br />
2.21).<br />
Pic. 2.21: Dynamic DNS<br />
5. Tick «Automatically update IP-address...», type in your name or your<br />
email in the field «Login», the one you used when registering for the service.<br />
Type in password in the field «Password», which you used when registering.<br />
Type in registered domain name in the field «Host name», e.g. example.dyndns.<br />
com<br />
6. Press «Apply». A record of successful IP-address update on the service will<br />
appear in the system log within a minute. If there is a record of unsuccessful<br />
update, check the details filled in.<br />
7. Setting up of automatic IP address update is finished.<br />
<strong>User</strong> <strong>Manual</strong>
Accessories<br />
Monitoring System may include the following components:<br />
• «Monitoring master units»:<br />
○ 19” IP monitoring master unit – 5500.824<br />
○ 19” IP monitoring master unit with outlets– 5510.824<br />
• «IP switchable metered PDUs»:<br />
○ 19” server switchable PDU with 8 outlets – 5510.008<br />
○ 19” switchable PDU with 8 outlets – 5510.108<br />
• «Extension units»:<br />
○ Relay-sensor unit (RS) – 5505.814<br />
○ Relay-sensor unit (RS) – 5505.816<br />
○ Contacts unit (BU) – 5505.016<br />
• «Analog sensors»:<br />
○ Temperature sensor – 5500.500<br />
○ Humidity sensor – 5500.511<br />
○ Outdoor temperature sensor – 5500.501<br />
○ AC voltage monitor – 5500.520<br />
○ DC voltage monitor – 5500.525<br />
○ Access sensor (reed switch + magnet) – 5500.530<br />
○ Vibration sensor – 5500.540<br />
○ Airflow sensor – 5500.550<br />
○ Smoke sensor – 5500.560<br />
○ Motion sensor – 5500.570<br />
○ Leakage sensor – 5500.590<br />
○ Water detection cable sensor – 5500.591<br />
• «Digital sensors»:<br />
○ Humidity and temperature sensor – 5500.731<br />
○ Smoke and temperature sensor – 5500.760<br />
○ Motion and temperature sensor – 5500.770<br />
• «Readers»:<br />
○ Wigand cards reader.<br />
○ iButton reader.<br />
• «Passive components»:<br />
○ Patch cable UTP<br />
○ Cables RJ-11 (6p4c)<br />
○ Software CD<br />
○ Power cables<br />
○ Water detection cable<br />
○ COM-port cable<br />
○ USB-RJ11 cable<br />
<strong>User</strong> <strong>Manual</strong><br />
- 45 -
Monitoring master unit<br />
- 46 -<br />
4.1 IP monitoring units – 5500.824, 5510.824<br />
Compact devices with dimensions 440×44×110, net weight 2 kg.<br />
It is possible to connect up to 8 analog, 20 digital sensors or 2 1-Wire readers, 16 dry contacts,<br />
up to 4 relay devices and up to 30 extension units, such as RS, BU or WT.<br />
Pic. 4.1:IP monitoring unit 5500.824/5510.824, front view<br />
Pic. 4.2: IP monitoring unit 5500.824/5510.824, front view<br />
Description of I/O on the front panel of 5500.824/ 5510.824<br />
Antenna is used by the GSM module of the system.<br />
SIM is needed for operation of GSM modem<br />
Micro SD provides the possibility to send voice messages.<br />
USB-port is used to connect USB flash drive or USB Cam.<br />
LAN-port for 10/100 Mbit, Ethernet connection using UTP/FTP cable.<br />
RS-485 port for connection of up to 30 extension units using UTP/FTP cable.<br />
TR switch is a load switch used to terminate extension devices for a long distance ~ 1km.<br />
Reset button. Hidden switch used for immediate system restart.<br />
LEDs on the front panel of 5500.824/ 5510.824<br />
PWR – Lights up several seconds after submission of power supply on the device.<br />
ALRM – Flashes when a disturbing event occurs in one of the sensors.<br />
PRG – Temporarily lights up during reprogramming of the device through USB port.<br />
ACT – Indicates exchange of data with extension units on RS-485 Bus.<br />
1, 2, 3, 4 – Shows state of relays on/off.<br />
<strong>User</strong> <strong>Manual</strong>
- 47 -<br />
Description of I/O on the back panel of 5500.824<br />
RLY 1..4. Each of the built-in relays is with 'closed' and 'open' contacts. Max. AC voltage<br />
250V and max. DC voltage up to 24V. Max. current on the relay up to 7A.<br />
DI-1-DI-2. 2 1-Wire bus RJ11 sockets to connect digital sensors with 2-pair UTP cable/4-<br />
wire telephone cable or readers for access control. It is necessary to use FTP cable to<br />
avoid electromagnetic interference. The maximum recommended length of the serial bus<br />
is 70 meters. Maximum of 10 sensors on each bus can be connected!<br />
IN1...IN8. 8 inputs RJ11 used to connect any analog sensors using RJ-11 6P4C cable. It<br />
is necessary to use FTP cable to avoid electromagnetic interference. The maximum recommended<br />
length is 30 meters.<br />
Antenna Connection of GSM antenna.<br />
Dry contacts. 16 dry address contacts. Needed for connection of contacts to doors, windows,<br />
locks etc. The maximum recommended length is 1 km.<br />
PWR jack. For 5500.824 master unit connection of external network adapter 12V with<br />
10Wt. Internal output “+”, external “-“. Any adapter for 9-14V, 10W can be used.<br />
Pic. 4.3: IP monitoring unit 5500.824, backside<br />
Pic. 4.4: IP monitoring unit 5500.824, backside<br />
<strong>User</strong> <strong>Manual</strong>
- 48 -<br />
Description of I/O on the back panel of 5510.824<br />
Back panel of unit 5510.824 contains the following I/O:<br />
Pic. 4.5: IP monitoring unit 5510.824, on the backside<br />
Pic. 4.6: IP monitoring unit 5510.824, on the backside<br />
Output 1..4. Are C13 230V connectors with closed relay contacts. Max. load current per<br />
one output - 5A. Max. total load current - 10А.<br />
PWR connectors IEC60320 C14. Power cable 230V IEC60320 C13.<br />
DI-1-DI-2. 2 1-Wire bus RJ11 sockets to connect digital sensors with 2-pair UTP cable/4-<br />
wire telephone cable or readers for access control. It is necessary to use FTP cable to<br />
avoid electromagnetic interference. The maximum recommended length of the serial bus<br />
is 70 meters. Maximum of 10 sensors on each bus can be connected!<br />
IN1...IN8. 8 inputs RJ11 used to connect any analog sensors using RJ-11 6P4C cable. It<br />
is necessary to use FTP cable to avoid electromagnetic interference. The maximum recommended<br />
length is 30 meters.<br />
<strong>User</strong> <strong>Manual</strong>
- 49 -<br />
5.2 IP Switchable Metered PDUs – 5510.108, 5510.008<br />
19" Compact devices with dimensions 440×44×116, net weight 2,5 kg.<br />
Description of outlets on the front panel of 5510.008/ 5510.108<br />
The front panel contains the following I/O and LEDs (See Pic. 4.7, Pic. 4.8):<br />
IN1,IN2 2 inputs RJ11 used to connect any analog sensors using RJ-11 6P4C cable. It is<br />
necessary to use FTP cable to avoid electromagnetic interference. The maximum recommended<br />
length is 30 meters.<br />
USB-port is used to connect USB flash drive or USB Cam.<br />
LAN-port for 10/100 Mbit, Ethernet connection using UTP/FTP cable.<br />
TR switch is a load switch used to terminate extension devices for long distance ~ 1km.<br />
Reset button. Hidden switch used for immediate system restart.<br />
COM 1..8 are RJ45 ports for connection to servers. (Only on 5510.008 IP PDUs).<br />
Pic. 4.7: IP PDU 5510.008 front side<br />
<strong>User</strong> <strong>Manual</strong><br />
Pic. 4.8: IP PDU 5510.108 front side<br />
LEDs on the front panel of 5510.008/ 5510.108<br />
PWR – Lights up several seconds after submission of power supply on the device.<br />
ALRM – Flashes when a disturbing event occurs in one of the sensors.<br />
PRG – Temporarily lights up during reprogramming of the device through USB port.
- 50 -<br />
ACT – Indicates exchange of data with extension units on RS485 Bus.<br />
1, 2, 3, 4 – Shows state of outlets on/off.<br />
Pic 4.9: IP PDU 5510.008/5510.108 LEDs on the front side<br />
Description of I/O on the IP PDU back panel of 5510.008/ 5510.108<br />
The back panel of IP PDU contains the following I/O and LEDs (See Pic. 5.10):<br />
PWR 1, 2 connectors C14. Power cable 230V IEC60320 C13. There are built-in 10A<br />
fuses on each line.<br />
Outputs 1...8 connectors C13 230V with relay contacts. Max. load current per one outlet<br />
- 5A. Max. total load current - 20А. Cables used IEC60320 C14/С13. If needed power<br />
can be switched on/off on each outlet remotely via IP.<br />
Current of each outlet is measured and is shown in the interface. In addition, power consumption<br />
is shown.<br />
Possibility to use 3-level access to IP PDU, allowing certain user to control certain outlet.<br />
Pic. 4.10: IP PDUs 5510.008/5510.108, back view<br />
Pic. 4.11: IP PDUs 5510.008/5510.108, back view<br />
<strong>User</strong> <strong>Manual</strong>
Extension units<br />
- 51 -<br />
5.1 Relay-sensor units – 5505.814, 5505.816<br />
Compact device with dimensions 145×44×100 net weight 0.6 kg. Possible connection up<br />
to 8 analog, 10 digital sensors or one 1-Wire reader and up to 4 relays.<br />
Description of I/O on the front panel of 5505.814, 5505.816<br />
The front panel of RS extension unit contains the following I/O and LEDs (Pic.5.1):<br />
RS-485 port is used for connection to any master unit and for connection of extension<br />
units into chain. UTP/FTP cable is used for connection.<br />
TR switch is a load switch used to terminate extension devices for long distance ~ 1km.<br />
IN1...IN8. (Analog sensors) 8 RJ11 ports used to connect analog sensors using cables<br />
with connectors RJ-11 6P4C. It is necessary to use FTP cable to avoid electromagnetic<br />
interference. Recommended max. length is 30 meters.<br />
DI-1 (Digital sensor) 1-Wire bus RJ11 socket to connect digital sensors using 2-pair UTP/<br />
FTP /4 wires phone cable or to connect access readers. It is necessary to use FTP cable to<br />
avoid electromagnetic interference. The maximum recommended length of the serial bus<br />
is 70 meters. Max. 10 sensors can be connected serially!<br />
Pic. 5.1: Relay-sensor unit, front view 5505.814, 5505.816<br />
<strong>User</strong> <strong>Manual</strong><br />
Pic. 5.2: Relay-sensor unit, front view 5505.814, 5505.816
- 52 -<br />
LEDs on the front panel of 5505.814, 5505.816<br />
PWR – power is supplied, the system is switched on.<br />
ACT – lights up when data is being communicated with master unit.<br />
Description of I/O on the back panel of 5505.814<br />
OUTPUTS 1...4 are IEC60320 C13 connectors with voltage output of 230V from relay<br />
outlets. Max. load current per one output - 5A. Max. total load current - 10А.<br />
INPUT PWR connector IEC60320 C14. Built-in fuse.<br />
Pic. 5.3: 5505.814 unit, backside<br />
Pic. 5.4: 5505.814 unit, backside<br />
<strong>User</strong> <strong>Manual</strong>
- 53 -<br />
Description of I/O on the back panel of 5505.816<br />
RLY1..4. Each of the built-in relays is with 'closed' and 'open' contacts. Max. AC voltage<br />
250V and max. DC voltage up to 24V. Max. current on the relay up to 7A.<br />
PWR jack for connection of external power 12V. Internal output “+”, external “-“. Any<br />
charger 9-14V with minimum power of 3 W can be used.<br />
1, 2, 3, 4 – indicate relays switched on/off.<br />
Pic. 5.5: 5505.816 unit, backside<br />
Pic. 5.6: 5505.816 unit, backside<br />
<strong>User</strong> <strong>Manual</strong>
- 54 -<br />
5.2 Dry contacts unit (BU) – 5505.016<br />
Compact device with dimensions 145*30*62, net weight 0.4 kg.<br />
Pic. 5.7: Dry contacts unit 5505.016, front view<br />
Pic. 5.8: Dry contacts unit 5505.016, front view<br />
Description of I/O on the front panel of 5505.016<br />
PWR. jack used only if BU unit is at a large distance from the master unit. Internal output<br />
“+”, external “-“. Any charger 12V with minimum power of 3W can be used.<br />
RS-485 serial port is required for connection to the master unit or to another extension unit<br />
using cable UTP / FTP.<br />
<strong>User</strong> <strong>Manual</strong>
- 55 -<br />
Description of I/O on the back panel of 5505.016<br />
Dry contacts 1..16 – 16 addressed contacts. Any dry contacts can be connected.<br />
Pic. 5.9: Dry contacts unit 5505.016, back side<br />
LEDs of 5505.016<br />
Pic. 5.10: Dry contacts unit 5505.016, back side<br />
PWR – power is supplied, the system is switched on.<br />
ACT – lights up when data is being communicated with master unit.<br />
<strong>User</strong> <strong>Manual</strong>
- 56 -<br />
5.3 GSM modem 5500.900<br />
5500.900 GSM-modem can be connected to any Sky Control master unit.<br />
Supported GSM frequencies range: 900/1800/1900.<br />
Transmit power: 2W/1W in 900/1800 range.<br />
Pic. 6.11: GSM modem with antenna<br />
<strong>User</strong> <strong>Manual</strong>
Sensors<br />
6.1 Analog Sensors<br />
- 57 -<br />
Analog sensors have one or two RJ-11 (6P4C) jacks for connection to analog input of any<br />
monitoring system's unit using RJ-11 patch cable. Second jack, if present, can be used for<br />
serial connection of several identical sensors in a circuit. At linear connection the chain of<br />
sensors will be automatically detected as one sensor, however, the monitoring system will<br />
generate an event when any of them operates. Linear connection of analog sensors can be<br />
used for smoke and non-contact sensors.<br />
Indoor temperature sensor – 5500.500<br />
Compact device with dimensions 60×18×18, net weight 50g. Supply includes: 4-wired<br />
telephone cable RJ11 (2m), 4.8*16mm screw. On the bottom there is a ledge with<br />
Ø4.5mm and height 1mm and a mounting hole in 50mm from it for fastening the sensor<br />
using 4.8x16mm screw.<br />
Pic. 6.1: Indoor temperature sensor<br />
Measured range of temperatures: from -40 to 100°С.<br />
Temperature sensor contains RJ-11 jack and is connected to an analog input IN1...IN8 of<br />
any system unit. Determination of type of sensor and connection occur automatically.<br />
Outdoor temperature sensor – 5500.501<br />
Cylinder of Ø12*28 with an emerging 15m 2-pair UTP cable with RJ11 connector, net<br />
weight 450g.<br />
<strong>User</strong> <strong>Manual</strong><br />
Pic. 6.2: Outdoor temperature sensor
- 58 -<br />
Measured range of temperatures: from -40 to 100°С.<br />
After installation of cylinder outside of a building, the UTP cable must be placed to reach<br />
the system unit. After installation RJ-11 connector is connected to an analog input IN1...<br />
IN8 of any system unit. Determination of type of sensor and connection occur automatically.<br />
Humidity sensor – 5500.511<br />
Compact device with dimensions 60×18×18, net weight 50g. Supply includes: 4-wired<br />
telephone cable RJ11 (2m), screw 4.8×16mm. On the bottom there is a ledge with Ø<br />
4.5 mm and height 1 mm; and a mounting hole in 50 mm from it for fastening sensor by<br />
4.8x16mm screw.<br />
Pic. 6.3: Humidity sensor<br />
Sensor is used for measurement of humidity 20-95% indoors with relative accuracy 5%.<br />
Humidity sensor contains RJ-11 jack and is connected to an analog input IN1...IN8 of<br />
any system unit. Determination of type of sensor and connection occur automatically.<br />
AC voltage monitor – 5500.520<br />
Device dimensions are 80×40×22, net weight 100g. Supply includes: USB RJ11 cable<br />
1.8m.<br />
<strong>User</strong> <strong>Manual</strong><br />
Pic. 6.4: AC voltage monitor<br />
Sensor is needed for measurement of standard power supply 220-230V or any other capacity<br />
in the power supply system
- 59 -<br />
Installation of AC voltage monitor<br />
Plug 230V is put into the outlet necessary for measurement of 230V. Cable's USB connector<br />
must be connected to the USB output, connector RJ-11 must be connected to an<br />
analog input IN1...IN8 of any system unit. Determination of sensor's type and connection<br />
occur automatically. The picture below shows USB – RJ11 pinouts:<br />
Pic. 6.5: RJ-11 USB pinout<br />
DC voltage monitor – 5500.525<br />
Compact device with dimensions 60×18×18, net weight 50g. Supply includes: cable<br />
RJ11 2m, 2-pin terminal strip type TBW-5-2p, 4.8x16mm screw. On the bottom there is a<br />
ledge with Ø4.5 mm and height 1 mm; and a mounting hole in 50 mm from it for fastening<br />
sensor by 4.8x16mm screw.<br />
Voltage measured: 0 -100 V.<br />
Pic. 6.6: DC voltage monitor<br />
Sensor has RJ-11 jack and is connected to analog input IN1...IN8 of any system module<br />
using RJ-11 cable. Determination and connection of sensor occur automatically. 2-pin<br />
terminal strip with measured voltage is connected to the other jack on the sensor.<br />
<strong>User</strong> <strong>Manual</strong>
- 60 -<br />
Access sensor – 5500.530<br />
Two compact devices with dimensions 60×18×18, net weight 80g. Supply includes: Contact<br />
sensor, magnet, 4-wired telephone patch cable RJ-11 (2m), two screws 4.8×16mm, 2<br />
screws M5 and 2 nuts, bracket. On the bottom there is a ledge with Ø4.5 mm and height 1<br />
mm; and a mounting hole in 50 mm from it for fastening sensor by 4.8x16mm screw.<br />
Pic. 6.7: Access sensor<br />
Installation of contact sensor<br />
Using patch-cable RJ-11 sensor is connected to an analog input IN1...IN8 of any system<br />
unit. Determination of sensor's type and connection occur automatically. One of devices<br />
in the kit, for example, magnet, is mounted on a door; the second device is mounted on a<br />
jamb of a door. At opening a door contact is disconnected, and system of monitoring receives<br />
notification on opening. The first sensor is connected using patch-cable RJ-11 to an<br />
analog input of the system unit, the consequent sensor is connected via patch-cable RJ-11<br />
to an output of the first sensor and so on.<br />
Vibration sensor – 5500.540<br />
Compact device with dimensions 60×18×18, net weight 50g. Supply includes: 4-wired<br />
telephone patch cable RJ11 (2m), screw 4.8*16mm. On the bottom there is a ledge with<br />
Ø4.5 mm and height 1 mm; and a mounting hole in 50 mm from it for fastening sensor by<br />
screw 4.8*16mm.<br />
<strong>User</strong> <strong>Manual</strong><br />
Pic. 6.8: Vibration sensor sensor<br />
RJ-11 jack is connected to an analog input IN1...IN8 of any system unit using RJ-11 patch
- 61 -<br />
cable. Determination of sensor's type and connection occur automatically. At impact or<br />
attempts of jolting or drilling of the surface on which the sensor is established, contacts of<br />
the sensor respond and the system receives message on breaking.<br />
Airflow sensors – 5500.550<br />
Compact device with dimensions 60×18×18, net weight 50g. Supply includes: 4-wired<br />
telephone cable RJ11 (2m), screw 4.8x16mm, double sided sticker, 4 airflow cables with<br />
sensor head. On the bottom there is a ledge with Ø4.5 mm and height 1 mm; and a mounting<br />
hole in 50 mm from it for fastening sensor by 4.8x16mm screw at any place near the<br />
fan.<br />
Pic. 6.9: Airflow sensor<br />
RJ-11 jack is connected to an analog input of any system unit using RJ-11 patch cable.<br />
Determination of sensor’s type and connection occur automatically. Airflow sensor cables<br />
are connected to the 4 holes on the side of sensor. Sensor heads are mounted near the fan<br />
airflow.<br />
Smoke sensor – 5500.560<br />
Standard smoke sensor with dimensions Ø100×45, net weight 220g. Supply includes:<br />
4-wired cable RJ11 (2m), 2 screws and 2 nuts M4, 2 screws 4.8×20mm. On the bottom<br />
there are mounting holes for fastening smoke sensor to the surface by 4.8x20mm screws<br />
or/and bracket and M4 screws. At installation indoors, in a rack and etc., the sensor monitors<br />
occurrence of smoke. Automatic restoration of power after the actuation.<br />
<strong>User</strong> <strong>Manual</strong><br />
Pic. 6.10: Smoke sensor
- 62 -<br />
Installation of smoke sensor<br />
Sensor's jack RJ-11 is connected to an analog input IN1...IN8 of any system unit using<br />
patch-cable RJ-11. Determination of the sensor's type and connection occur automatically.<br />
The system of monitoring allows to connect several smoke sensors into a linear circuit.<br />
For this purpose each smoke sensor has two jacks RJ-11: input and output. The first sensor<br />
is connected to an analog input of the system unit using a patch-cable RJ-11, the consequent<br />
sensor is connected via patch-cable RJ-11 to an output of the first sensor and so on.<br />
Such chain is seen by the system as one sensor with one address.<br />
Motion sensor – 5500.570<br />
Device with dimensions 105×57×40, net weight 125g. Supply includes: built in 4-wired<br />
telephone patch cable RJ11 (2m), screws, plastic bracket, manual. On the bottom there is<br />
a mounting slot for fastening sensor by plastic bracket.<br />
Pic. 6.11: Motion sensor<br />
To adjust sensitivity of PIR sensor open the cover and follow the instructions in the<br />
manual (supplied with the sensor).<br />
Sensor contains RJ-11 jack and is connected to an analog input IN1...IN8 of any system<br />
unit. Sensor type is determined automatically.<br />
Connecting RJ11 to motion sensor:<br />
<strong>User</strong> <strong>Manual</strong><br />
Connecting RJ11 to motion sensor
- 63 -<br />
Leakage sensor – 5500.590<br />
Compact device of dimensions 60*18*18mm with an emerging 2-pair UTP cable 2m, net<br />
weight 60g. Supply includes: 4-wired telephone cable RJ-11 (2m), bracket, 2 screws and<br />
2 nuts M5, screw 4.8x16mm. Being horizontally installed on a vertical surface the sensor<br />
controls occurrence of water. When water is in contact with the metal cores, the sensor<br />
indicates the emergence of moisture.<br />
Pic. 6.12: Leakage sensor<br />
On the bottom there is a ledge with Ø4.5 mm and height 1 mm; and a mounting hole in<br />
50 mm from it for fastening sensor by screw 4.8x16mm. There are two metal cores on the<br />
side of device.<br />
Connector RJ11 is connected to an analog input IN1...IN8 of any system unit. Determination<br />
of sensor's type and connection occur automatically.<br />
Water cable detector – 5500.591<br />
Compact device with dimensions 60×18×18, net weight 25g. Supply includes: cable,<br />
terminal strip type TBW-5-2p, screw 4.8x16mm.<br />
On the bottom there is a ledge with Ø4.5 mm and height 1 mm; and a mounting hole in<br />
50 mm from it for fastening sensor by screw 4.8x16mm. 2-pin terminal strip type TBW-5-<br />
2p with mounted water detection cable is plugged into sensor’s connector.<br />
<strong>User</strong> <strong>Manual</strong><br />
Pic. 6.13: Water cable detector<br />
Connector RJ11 is connected to an analog input IN1...IN8 of any system unit. Determina
- 64 -<br />
tion of sensor’s type and connection occur automatically.<br />
The other end of the sensor connects 2-wire water detection cable with the plug.<br />
6.2 Digital sensors<br />
The bodies of digital sensors have two RJ11 (6P4C) jacks for connection to any digital<br />
input DI1, DI2 of any system’s unit. Second jack can be used for connection of one or<br />
several more digital sensors into 1-Wire digital circuit in any order.<br />
Attention! It is possible to connect up to 10 digital sensors consistently in one digital port in any<br />
order.<br />
This type of connection allows each sensor to be automatically determined, and monitoring<br />
system will be able to distinguish them.<br />
In addition, monitoring system allows to connect to digital port of any unit iButton key<br />
reader or Proximity card reader. The reader will be determined and installed automatically.<br />
Only 1 reader can be connected to 1 digital port.<br />
Humidity and temperature sensor – 5500.731<br />
Compact device with dimensions 60×18×18, net weight 50g. Supply includes: 4-wired<br />
telephone patch cable RJ-11 (2m), 4.8*16mm screw. On the bottom there is a ledge with<br />
Ø4.5 mm and height 1 mm; and a mounting hole in 50 mm from it for fastening sensor<br />
using screw 4.8x16mm.<br />
Digital humidity sensor contains built-in temperature sensor.<br />
Measured range of temperatures: -20...+ 60°C.<br />
Measured range of humidity: 10-90%.<br />
<strong>User</strong> <strong>Manual</strong><br />
Pic. 6.14: Humidity and temperature sensor<br />
Humidity sensor contains RJ11 jack and is connected to digital input DI1, DI2 of any system<br />
unit or any other digital sensor's output. Determination of sensor's type and connection<br />
occur automatically. Connection of digital sensors is serial, it is possible to connect to<br />
one digital port of any monitoring unit up to 10 digital sensors in any order.
- 65 -<br />
Smoke and temperature sensor – 5500.760<br />
Standard smoke sensor with dimensions Ø100×45, net weight 220g. Supply includes:<br />
4-wired telephone patch cable RJ11 (2m), bracket, 2 screws and 2 nuts M4, 2 screws<br />
4.8x20mm. On the bottom there are mounting holes for fastening smoke sensor to the<br />
surface using screws 4.8x20mm or/and bracket and M4 screws.<br />
Pic. 6.15: Smoke sensor<br />
At installation indoors, inside the rack etc., sensor monitors occurrence of smoke and<br />
temperature inside the building.<br />
Measured range of temperatures: -20...+ 60°C.<br />
Installation of smoke sensor<br />
Sensor’s jack RJ-11 is connected to a digital input DI1, DI2 of any system unit or to an<br />
output of another digital sensor using RJ-11 patch cable. Determination of sensor’s type<br />
and connection occur automatically.<br />
Monitoring system allows connection of several smoke sensors into a linear circuit. For<br />
this purpose each sensor has two RJ-11 jacks: input and output. The first sensor is connected<br />
to digital input of any system unit using RJ-11 patch cable. The consequent sensor<br />
is connected via RJ-11 cable to output of the first sensor and so on. Such chain of sensors<br />
is seen as several sensors with different addresses.<br />
Motion and temperature sensor – 5500.770<br />
Device with dimensions 105×57×40, net weight 125g. Supply includes: built in 4-wired<br />
telephone patch cable RJ11 (2m), screws, plastic bracket, sensor manual. On the bottom<br />
there is a mounting slot for fastening sensor by plastic bracket.<br />
Measured range of temperatures: -20...+ 60°C.<br />
Temperature sensor contains RJ-11 jack and is connected to a digital input DI1, DI2 of<br />
any system unit or an output of another digital sensor. Determination of sensor’s type<br />
and connection occur automatically. Possibility to connect up to 10 sensors into a linear<br />
circuit.<br />
<strong>User</strong> <strong>Manual</strong>
- 66 -<br />
Pic. 6.16: Motion sensor<br />
Monitoring system allows connection of several PIR sensors into a linear circuit. For this<br />
purpose you need to open the cover, connect cable according to the manual supplied with<br />
the sensor.<br />
Connecting RJ11 to motion sensor:<br />
6.3 Readers<br />
Connecting RJ11 to motion sensor<br />
Monitoring system supports several types of 1-Wire readers. I-Button key readers and<br />
Proximity card readers.<br />
Pic. 6.17: I-Button reader Pic. 6.18: I-Button keys Pic. 6.19: Proximity reader<br />
Proximity card readers function in a convenient non-contact mode.<br />
<strong>User</strong> <strong>Manual</strong>
SNMP Server<br />
- 67 -<br />
Monitoring and partial system configuration can be performed via SNMP protocol, supported<br />
versions 1 (RFC 1157) and 2 (RFC 1902 .. 1907). In addition, the system provides<br />
the ability to send Traps, which can be used as notifications for the logic.<br />
Detailed information can be found on CD supplied together with the system or on www.<br />
skycontrol.com.<br />
List of USB-cameras supported by the system of<br />
monitoring Sky Control<br />
3Com Home Connect Lite<br />
3DeMON USB Capture<br />
ADS Instant VCD<br />
Agfa ephoto CL20<br />
Aiptek DV3500 Mpeg4<br />
Aiptek mini PenCam 1.3<br />
MPixels<br />
Aiptek Mini PenCam 2<br />
MPixels<br />
Aiptek Pencam SD 2 MPixels<br />
Aiptek PocketCam 2Mega<br />
Aiptek PocketCam 3 M<br />
Aiptek Pocket Cam 4M<br />
Aiptek PocketDV<br />
Aiptek PocketDV3100+<br />
Aiptek Pocket DV5100<br />
Aiptek Pocket DV5300<br />
Aiptek PocketDVII 1.3<br />
MPixels<br />
Aiptek Slim3000F<br />
Aiptek Slim 3200<br />
ApexDigital Digitrex2110 spca533<br />
Arowana 300K CMOS<br />
Camera<br />
Benq DC1016<br />
Benq DC1300<br />
Benq DC1500<br />
Genius VideoCAM NB<br />
Genius Videocam V2<br />
Genius Videocam V3<br />
Grandtec V.cap<br />
Hama USB Sightcam 100<br />
Hama USB Sightcam 100 (2)<br />
ICM532 cam<br />
Intel Create and Share<br />
Intel Easy PC Camera<br />
Intel PC Camera Pro<br />
<strong>User</strong> <strong>Manual</strong><br />
Intel Pocket PC Camera<br />
Jenoptik DC 21 LCD<br />
JVC GC-A50<br />
Kodak DVC-325<br />
Kodak EZ200<br />
Kowa Bs888e MicroCamera<br />
Labtec Webcam<br />
Labtec Webcam Elch2<br />
Labtec Webcam Notebook<br />
Labtec Webcam Plus<br />
Labtec Webcam Pro<br />
LG LIC-200<br />
LG Lic-300<br />
Logitech ClickSmart 310<br />
Logitech ClickSmart 820<br />
Logitech Inc. ClickSmart 420<br />
Logitech Inc. ClickSmart 510<br />
Logitech Notebook Deluxe<br />
Mustek DV4000 Mpeg4<br />
Mustek Gsmart 300<br />
Mustek Gsmart D30 spca533<br />
Mustek Gsmart LCD 2<br />
Mustek Gsmart LCD 3<br />
Mustek Gsmart Mini<br />
Mustek gSmart mini 2<br />
Mustek gSmart mini 3<br />
Mustek MDC3500<br />
Mustek MDC4000<br />
Mustek MDC5500Z<br />
Mustek Wcam300A<br />
Mustek WCam300AN<br />
Mustek Wcamm300A 2<br />
Optimedia TechnoAME<br />
PalmPix DC85<br />
PC-Cam350<br />
PetCam<br />
Philips SPC200NC<br />
Philips SPC300NC<br />
Philips SPC600NC<br />
Philips SPC700NC<br />
Pixart PAC207-BCA<br />
Polaroid Ion 80<br />
Polaroid PDC2030<br />
Polaroid PDC3070<br />
Pure Digital Dakota 62<br />
Benq DC3410<br />
Concord 3045 spca536a<br />
Creative Instant P0620<br />
Creative Instant P0620D<br />
Creative Live!<br />
Creative Mobile PD1090<br />
Creative Notebook PD1170<br />
Creative Notebook PD1171<br />
Creative NX<br />
Creative Nx Pro<br />
Creative NX Pro FW2<br />
Creative PC-CAM 300<br />
Creative PC-CAM 600<br />
Creative PCcam750<br />
Creative Webcam NX ULTRA<br />
Creative Webcam Vista<br />
Creative Webcam Vista<br />
Creative Webcam Vista Plus<br />
CTX M730V built in Cam<br />
Digital Dream Enigma 1.3<br />
Digital Dream Epsilon 1.3<br />
D-Link DSC-350<br />
Flexcam 100 Camera<br />
FlyCam Usb 100<br />
Generic Vimicro 303b<br />
Generic Zc0305b<br />
Genius Dsc 1.3 Smart spca504B-P3<br />
Genius GF112<br />
Genius VideoCAM Express
Genius Videocam Express V2<br />
Firmware 2<br />
Genius VideoCam Ge111<br />
Logitech QCIM<br />
Logitech QuickCam chat<br />
Logitech QuickCam chat<br />
Logitech QuickCam<br />
Communicate STX<br />
Logitech QuickCam Express II<br />
Logitech QuickCam for<br />
Notebook<br />
Logitech QuickCam for<br />
Notebooks<br />
Logitech QuickCam IM<br />
Logitech QuickCam Image<br />
Logitech QuickCam IM/Connect<br />
Logitech QuickCam IM ftp mib yur<br />
Logitech QuickCam IM + sound<br />
Logitech QuickCam Traveler<br />
Mars-Semi Pc-Camera MR97311<br />
MI0360<br />
Maxell Compact PC PM3<br />
Maxell Max Pocket LEdit. 1.3<br />
MPixels<br />
Megapix V4<br />
Mercury Cyberpix S550V<br />
Mercury Digital Pro 3.1Mp<br />
Mercury Peripherals Inc.<br />
Micro Innovation IC200<br />
Micro Innovation WebCam 320<br />
Mustek Digicam 330K<br />
Mustek DV 3000<br />
QCam Sangha<br />
QCam xxxxxx<br />
QC Express<br />
Qtec Webcam 100<br />
Sangha 350k<br />
Smile International<br />
Sonix Btc PC380<br />
Sonix Pccam +<br />
Sonix PcCam<br />
Sonix sn9c102P Hv7131R<br />
Sonix sn9c10x + Pas106<br />
sensor<br />
Sonix VGA Ov7630<br />
Speed NVC 350K<br />
Sunplus CA500C<br />
Sunplus Generic spca536a<br />
Sweex SIF webcam<br />
Terratec 2 move 1.3<br />
Toptro Industrial<br />
Typhoon Webshot II<br />
Unknow Ori Camera<br />
Usb Grabber PV321c<br />
Veo Stingray 1<br />
Veo Stingray 2<br />
VideoCam Messenger<br />
sn9c101 Ov7630<br />
ViewQuest M318B<br />
ViewQuest VQ110<br />
Xcam Shanga<br />
Z-star Vimicro zc0301p<br />
<strong>User</strong> <strong>Manual</strong>
www.skycontrol.com